Confidence Interval Analysis: Ad Testing Guide
Jump to a section
- Why Confidence Interval Analysis Matters in Ad Testing
- The Core Idea Behind a Confidence Interval
- Analytical and Bootstrap Methods for Building an Interval
- Reading Intervals for A/B and Multivariate Ad Tests
- Calculating Confidence Intervals in Excel, Python, and R
- Where Confidence Intervals Quietly Mislead
- Putting It All Together in a Creative Testing Workflow
You've got two creative variants in Ads Manager, one looks cleaner on CPA, the other has a slightly better CTR, and the dashboard makes both look close enough to argue about in Slack. That's the exact moment confidence interval analysis earns its keep, because the point estimate tells you what happened, while the interval tells you how much of that result could just be noise.
For performance teams shipping multivariate ads on Meta, TikTok, and beyond, that distinction isn't academic. The wrong read can send budget to a creative that only looked better because exposure was uneven, the sample was thin, or the platform's delivery system favored one version early.
Why Confidence Interval Analysis Matters in Ad Testing
A media buyer rarely loses sleep over a single number. The harder problem is deciding whether “Variant B is ahead” means anything durable enough to fund with more spend. Confidence interval analysis turns that judgment into a decision rule instead of a statistics exercise.
A point estimate gives you the headline, like CTR, CPA, or ROAS for a creative. A confidence interval turns that headline into a range, which is much closer to how creative testing behaves when impressions arrive unevenly, audiences skew, and the platform keeps learning while you are still evaluating the test.
The decision problem behind the dashboard
Meta and TikTok reports can make two ads look different while the underlying evidence is still fragile. A narrow-looking gap in ROAS can disappear once you account for the fact that the interval describes the estimate, while the team's desire for a winner is just a reaction to the chart.
Performance marketers care about the interval because it shows whether the result is precise enough to act on, or whether the dashboard is overstating certainty. A creative can rank first and still be too noisy to scale with confidence.
Practical rule: if the interval is still wide enough that your “winner” could easily be a loser in another sample, the test has not settled the question yet.
Why the history matters for marketers
Confidence interval analysis is now standard, but it did not become standard quickly. Jerzy Neyman formalized the modern statistical foundation in 1937, while medical adoption lagged by more than 20 years and one review says confidence intervals were not generally applied in medical science until 1959 (physiology review). That delay matters because it shows how long it can take for rigorous uncertainty thinking to replace simpler point-estimate habits.
For growth teams, the parallel is obvious. Creative testing has plenty of dashboards, but far fewer disciplined reads of what those dashboards can support.
If you already compare tests against statistical significance, the same problem is sitting underneath the label, just with a more useful framing. The difference between a lucky spike and a real effect is often hidden in the range, not the ranking. For a related foundation, see understanding statistical significance.
The Core Idea Behind a Confidence Interval
A confidence interval gives a bounded answer to a simple question, how far could this estimate reasonably be from the truth? The cleanest mental model is the dartboard. Each repeated sample lands in a slightly different place, and the interval marks the range that should capture the true value most of the time.
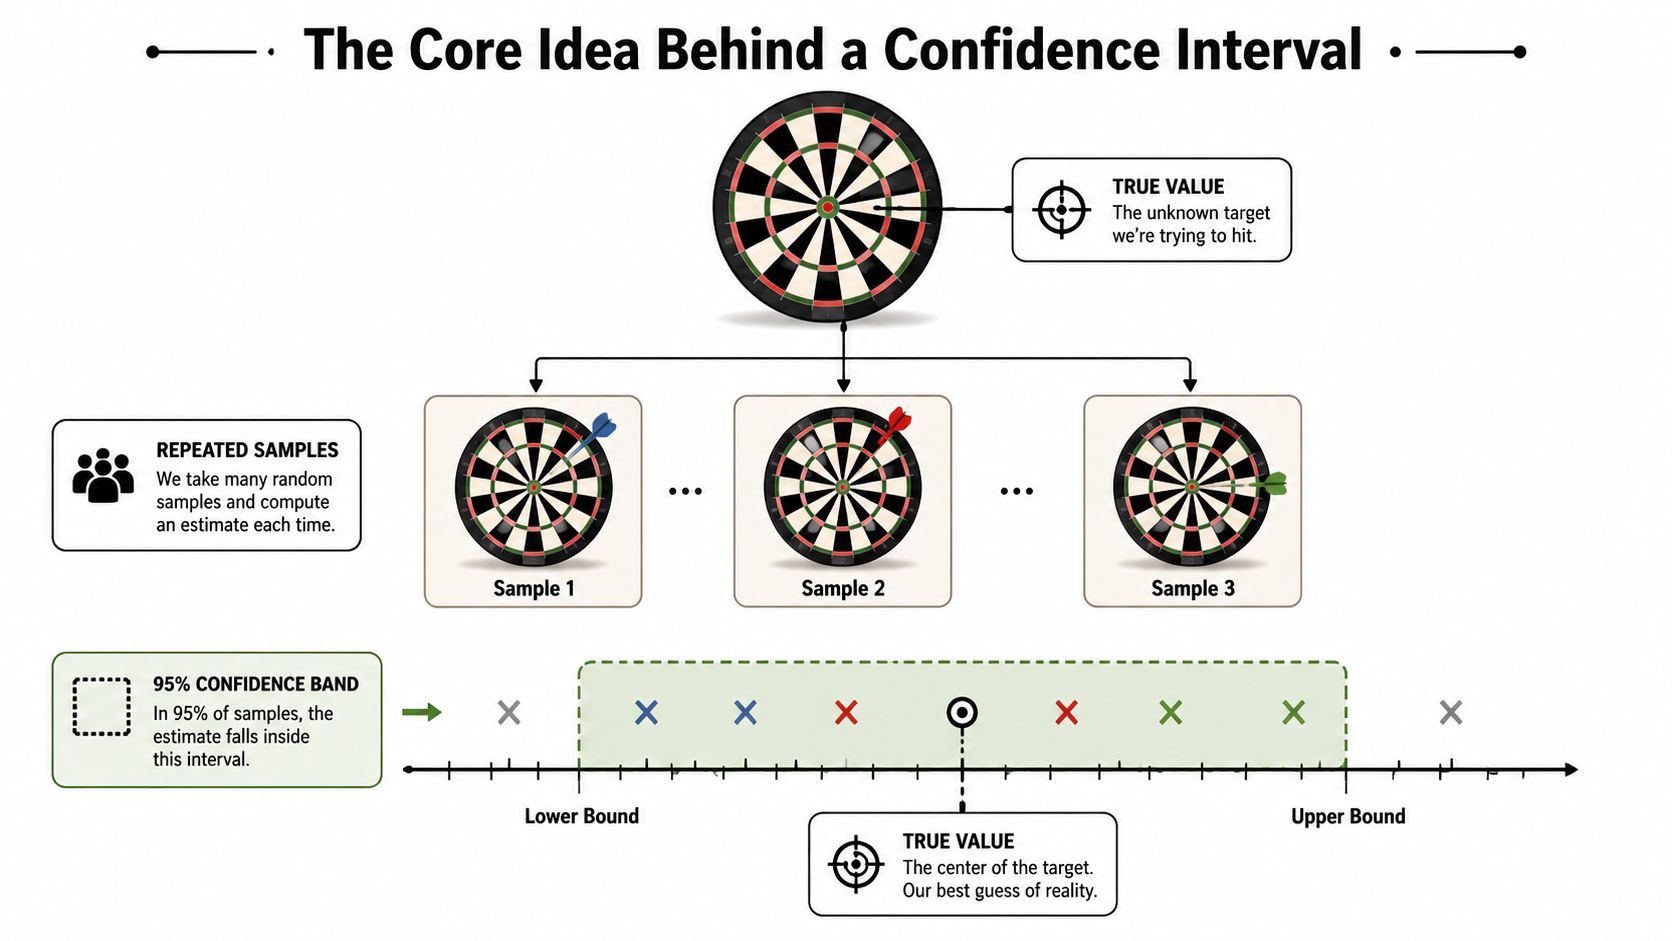
The structure is straightforward. The point estimate is your best single guess. The margin of error is the spread around that guess. The confidence level describes how often the method succeeds across repeated samples.
What 95% confidence actually means
The usual benchmark is 95%. In repeated sampling terms, if the same study were run many times and a 95% confidence interval were computed each time, about 95% of those intervals would contain the true population value, while the other 5% would miss it (U.S. Census Bureau guidance).
That statement belongs to the method, not to the single interval on your screen. A 95% interval is a statement about long-run performance, not a personal probability attached to one result.
A real published range
The U.S. Census Bureau gives a 90% confidence interval example for the number of people in poverty in 1995, from 35,534,124 to 37,315,094 (U.S. Census Bureau guidance). The range shows the method in plain sight, turning one estimate into a bounded set of plausible values.
For ad testing, the same logic applies to CTR, conversion rate, hook rate, or CPA. A raw number rarely tells you whether a small uplift is worth budget reallocation. A range does, because it puts uncertainty directly into the decision.
A confidence interval answers, “How precise is this estimate?” It does not answer, “What will happen next time?”
If you are linking statistical confidence to test design, the sample size question comes first. The interval is only as useful as the data behind it, which is why sample size planning has to sit upstream of the analysis. For a related foundation, see understanding statistical significance.
Analytical and Bootstrap Methods for Building an Interval
The method should follow the metric, not the spreadsheet. A simple average with a large sample usually works well with an analytical formula. Proportions with small samples, rates near zero or one, and derived metrics like ROAS need more care, because the standard shortcut can make the interval look cleaner than the data supports.
The common formulas and where they fit
For means, the t-based interval is the standard choice when you are estimating an average from sample data. For proportions, many teams start with the Wald or normal approximation, but that shortcut is most reliable when the sample is large and the event rate sits well away from the extremes.
A stronger choice for proportions is often the Wilson interval or an exact-binomial interval. Comparative statistical work shows that different proportion methods can produce materially different widths and coverage, which is why the method matters more as samples get smaller or event rates get more extreme (comparative work on CI methods).
NIST's guidance also shows that exact-binomial interval construction can require root-finding rather than a simple plug-in formula. That matters for marketing teams testing low-volume ads, where the friendly “margin of error” framing hides the harder edge cases.
When bootstrap is the safer answer
Bootstrapping helps when the sampling distribution is unclear or the metric is nonstandard. That includes ratio metrics, winsorized ROAS, or other derived values where the usual textbook assumptions do not match the data well.
Decision rule: if the metric is simple and the sample is healthy, use an analytical interval. If the metric is weird, sparse, or built from a ratio, bootstrap is often the more honest path.
A practical way to choose is below.
| Metric type | Recommended method | When to avoid the simpler choice |
|---|---|---|
| Mean of a numeric outcome | t-based interval | When the sample is tiny or the distribution is extremely skewed |
| Proportion or rate | Wilson or exact-binomial interval | When the event rate is extreme or the sample is small |
| Derived ratio metric | Bootstrap interval | When a plug-in formula hides unstable variance |
| Small-sample conversion test | Exact-binomial or bootstrap | When the normal approximation makes the band look cleaner than it is |
For hands-on calculation patterns, pair your interval method with the sample plan in sample size guidance. A method choice cannot rescue a test that never collected enough information to support a stable read.
For teams comparing test setups and workflows, Headline's A/B testing strategies is a useful operational reference.
Reading Intervals for A/B and Multivariate Ad Tests
A confidence interval only matters if you know how to read it against another variant. In ad testing, the practical question is not “Does Variant B have an interval?” It's “Does its interval support a real decision against Control?”
Overlap tells you more than the point estimate does
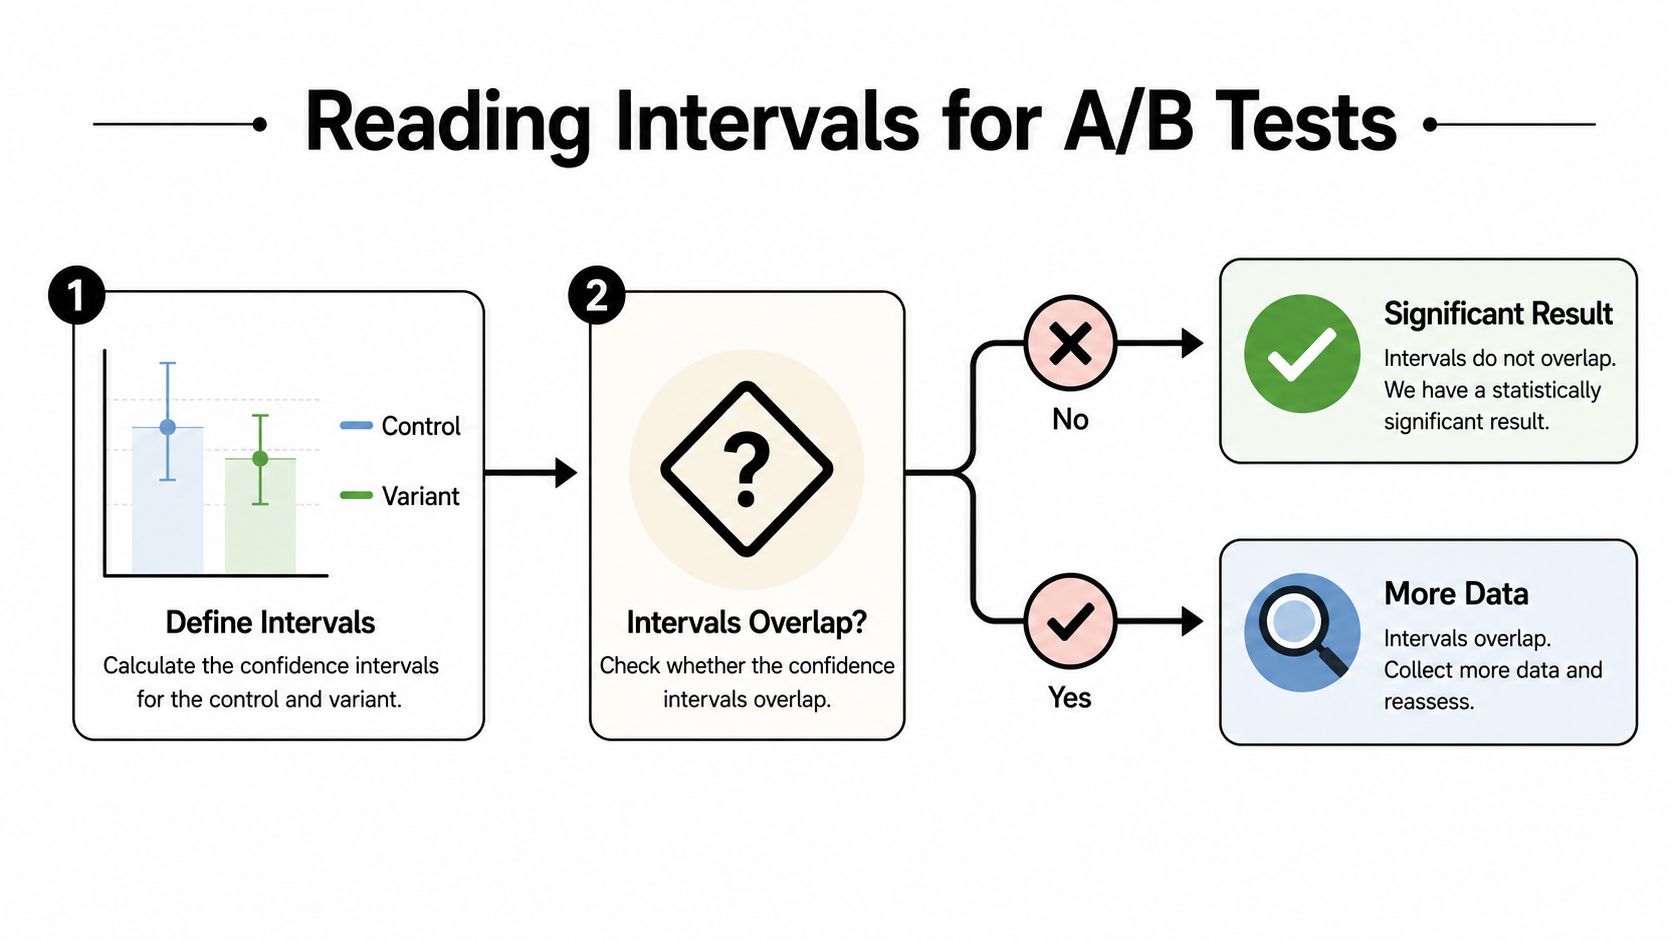
If two 95% confidence intervals do not overlap, that's strong evidence the difference is not just random noise. If they do overlap, that does not prove the variants are equal. It only says the data haven't separated them cleanly enough to make a confident call.
That matters for CTR, hook rate, and CPA, because these metrics can move in different directions while still looking visually close. A slightly higher CTR with a worse CPA might still be a bad trade, and interval overlap helps expose that tension instead of hiding it behind the top-line number.
The easiest internal standard is simple. If the intervals are clearly separated, you have a strong candidate. If they overlap materially, keep the test running unless the business cost of delay is worse than the risk of a wrong decision.
For teams comparing test setups and workflows, Headline's A/B testing strategies is a useful reference point because it keeps the focus on disciplined comparison, not just creative intuition.
Multivariate tests need extra caution
Multivariate creative testing adds another layer of risk. Once you run multiple hooks, bodies, and CTAs in parallel, the chance of seeing a false standout rises because you're making many comparisons at once. One interval per comparison can look tidy while the full experiment is still noisy.
The cleanest operational habit is to stop thinking in terms of “winner found” after the first flashy lift. Instead, ask whether the pattern holds across the set of comparisons you care about.
Don't let one bright result outrun the rest of the matrix. In multivariate testing, the strongest-looking arm is often just the first one to benefit from noise.
If you use a multivariate testing workflow, keep your comparison logic aligned with the test structure itself. A practical starting point is multivariate ad testing tooling, because the analysis is only as good as the way the variants were assembled in the first place.
Calculating Confidence Intervals in Excel, Python, and R
The fastest way to get practical is to use the tool your team already trusts. Excel is good for quick checks, Python is better for repeatable analysis, and R is strong when you want built-in statistical routines with resampling options.

Excel for a fast read
Excel has built-in functions like CONFIDENCE.NORM and CONFIDENCE.T. They're useful when you already have the mean, standard deviation, sample size, and confidence level, and you just need a quick interval rather than a custom pipeline.
For a manual check, the structure is straightforward, compute the standard error, multiply by the relevant critical value, then add and subtract that margin from the point estimate. That workflow makes the logic visible, which helps when you're explaining the result to a buyer or creative lead.
Python for repeatable analysis
Python works well when the same test pattern gets reused every week. A common setup uses scipy.stats for t-based intervals and proportion intervals, then numpy or pandas for bootstrap resampling when the metric is more complex.
That matters for ad data because creative tests tend to repeat. Once your pipeline is in code, you can standardize the calculation instead of re-deriving it in a spreadsheet each time the team launches a new batch.
R for statistical routines and resampling
R is strong for built-in tests like t.test and prop.test, especially when a team already lives in an analytic environment. If you need bootstrap intervals, the boot package is a natural fit because it supports resampling without forcing the rest of your workflow into a spreadsheet.
| Tool | Best for | Weak spot |
|---|---|---|
| Excel | Quick, one-off checks | Harder to automate and audit at scale |
| Python | Repeatable ad reporting workflows | Requires a bit more setup |
| R | Statistical testing and resampling | Less familiar to some growth teams |
If you want a quick sanity check on a live ad set, a calculator is often enough. For that, this AB test calculator can speed up the first pass before you move into deeper analysis.
Where Confidence Intervals Quietly Mislead
A confidence interval can tell you how much of a lift is likely to be noise. It cannot clean up biased exposure, broken attribution, or selective delivery, and that gap is where ad tests often go off track.
The useful side
A confidence interval separates signal from sampling variation and gives the team a common frame for uncertainty. That matters in creative testing because raw averages hide how unstable a result may be.
It also helps analysts decide whether a change in hook, offer, or format is strong enough to justify another round of production. For a walkthrough of how that judgment changes in video-heavy testing, see how to test video ad creatives.
The dangerous side
Public health guidance makes a clean distinction here. A confidence interval reflects imprecision from random variation, while systematic error sits outside the interval entirely (public health technical guidance). In ad platforms, that means biased exposure, attribution rules, missing data, and optimization bias can all shape the result before the interval is calculated.
A narrow band around a skewed sample still describes a skewed sample. The interval can be mathematically tidy while the underlying test remains misleading.
The interpretation traps
A frequent error is reading a 95% confidence interval as a 95% probability that the exact interval contains the truth. Another is ending the test as soon as the interval crosses a target and treating that as closure. Both habits overstate certainty, and both can send budget toward the wrong creative.
Small-sample proportion tests create another failure mode. Comparative work on interval methods shows that coverage and width can change meaningfully across approaches, so a standard approximation may look more precise than the data justify (comparative work on CI methods).
A clean interval does not mean a trustworthy result. If exposure is biased, the interval only measures the wrong thing with better formatting.
Multiple creative arms add a separate risk. The more variants you compare at once, the easier it is to mistake a noisy outlier for a real winner. Confidence intervals still help, but they do not replace disciplined design, especially when teams are tracking proportions, sparse conversion events, or ad sets that receive uneven delivery. They also do not substitute for getting SMS codes securely when account verification is part of the workflow.
Putting It All Together in a Creative Testing Workflow
A creative test should start before the first impression goes out. Define the hypothesis, choose the metric that matches the decision, set the confidence level, and size the test so the interval is narrow enough to support an action, not just a discussion.
A practical operating sequence
- Define the question clearly. If you are testing hooks, the question may be about hook rate. If you are testing offers, CPA or ROAS may matter more.
- Choose the interval method early. Simple rates can use standard methods, but sparse or ratio-based data often need a better interval or bootstrap.
- Run long enough for the band to settle. A result that looks decisive too early often changes once more data arrives.
- Read the interval against the business threshold. A statistically acceptable uplift can still be too small to matter.
- Document the decision. Keep the result, the interval, the metric definition, and the exposure rules in the same place so the next test does not repeat the same ambiguity.
If you are testing video assets, the same discipline applies to the structure of the creative itself, not just the names of the variants. A useful companion resource for production-side planning is how to test video ad creatives, because the quality of the test begins with the quality of the variation.
The adoption lesson for growth teams
The method was formalized long before it became routine in applied work, and that lag matters. A technique can be sound on paper and still stay underused if teams do not build habits around it.
Marketing has the same problem. Point estimates are easy to read, but confidence intervals are what let teams ship with discipline instead of optimism. If account access is part of the testing workflow, getting SMS codes securely can help keep operations reliable while experiments are running.
Sovran helps performance marketers build modular video variations, launch them faster, and keep the testing process tied to evidence instead of gut feel. Visit Sovran to see how a structured creative pipeline can make your next confidence interval easier to trust and faster to act on.

Manson Chen
Founder, Sovran
Related Articles
How to Read Test Results: A Creative Data Guide

Customer Journey Mapping for Performance Marketing